---title: "Solution Rmarkdown"author: "Sten Willemsen"date: "2024-06-06"output: html_document: code_folding: hide---## Setup::: {.cell}```{.r .cell-code}dat <-read.csv("Data/R_data2.csv")```:::## Introduction## DataWe perform the following data transformation steps:* We define the variable `pregnancy_length` by adding together. * We define the variable `BMI_cat` by dividing the variable BMI into categories: <18.5 ("Underweight"), 18.5 - 24.9 ("Healthy weight"), 25 - 29.9 ("Overweight"), and >30 (Obesity).* We log transform `homocysteine` and `vitaminB12`.* We transform the categorical variables to factors. * We remove the original variables `pregnancy_length_weeks`, `pregnancy_length_days`, `BMI` and `homocysteine` and `vitaminB12` from the data set.::: {.cell}:::## Analysis and Results We show descriptives of all variables in the data set.### Descriptives::: {.cell}```{.r .cell-code}for(i in1:length(names(dat))){if(class(dat[[i]]) =="numeric"){print(paste("Mean of", names(dat)[i], ":", mean(dat[[i]])))print(paste("Standard deviation of", names(dat)[i], ":", sd(dat[[i]]))) } elseif(class(dat[[i]]) =="factor"){print(paste("Frequency of", names(dat)[i], ":"))print(table(dat[[i]])) }}```::: {.cell-output .cell-output-stdout}```[1] "Frequency of Status :"normal brain development intellectual disability 108 82 [1] "Frequency of iodine_deficiency :" no yes 113 77 [1] "Frequency of educational_level :" high intermediate low 63 82 45 [1] "Frequency of alcohol :" no yes 84 106 [1] "Frequency of smoking :" no yes 151 39 [1] "Frequency of medication :" no yes 159 31 [1] "Mean of SAM : 73.6157894736842"[1] "Standard deviation of SAM : 17.5907251643386"[1] "Mean of SAH : 17.5905263157895"[1] "Standard deviation of SAH : 3.3569346588125"[1] "Mean of cholesterol : 16.9436842105263"[1] "Standard deviation of cholesterol : 0.93256039721745"[1] "Mean of HDL : 26.4723157894737"[1] "Standard deviation of HDL : 0.351814503286772"[1] "Mean of triglycerides : 8.06752631578947"[1] "Standard deviation of triglycerides : 0.517036413362704"[1] "Mean of folicacid_serum : 32.7689473684211"[1] "Standard deviation of folicacid_serum : 7.46542180292768"[1] "Mean of folicacid_erys : 1295.03288526895"[1] "Standard deviation of folicacid_erys : 207.393136290194"[1] "Mean of pregnancy_length : NA"[1] "Standard deviation of pregnancy_length : NA"[1] "Frequency of BMI_cat :" Underweight Healthy weight Overweight Obesity 1 104 76 9 [1] "Mean of log_homocysteine : 2.84472518390326"[1] "Standard deviation of log_homocysteine : 0.189749427662033"[1] "Mean of log_vitaminB12 : 5.93285200936397"[1] "Standard deviation of log_vitaminB12 : 0.291889003071043"```::::::For the continuous ones we also make a histogram.::: {.cell}```{.r .cell-code}for(i in1:length(names(dat))){if(class(dat[[i]]) =="numeric"){hist(dat[[i]], main =paste("Histogram of", names(dat)[i])) }}```::: {.cell-output-display}{width=672}:::::: {.cell-output-display}{width=672}:::::: {.cell-output-display}{width=672}:::::: {.cell-output-display}{width=672}:::::: {.cell-output-display}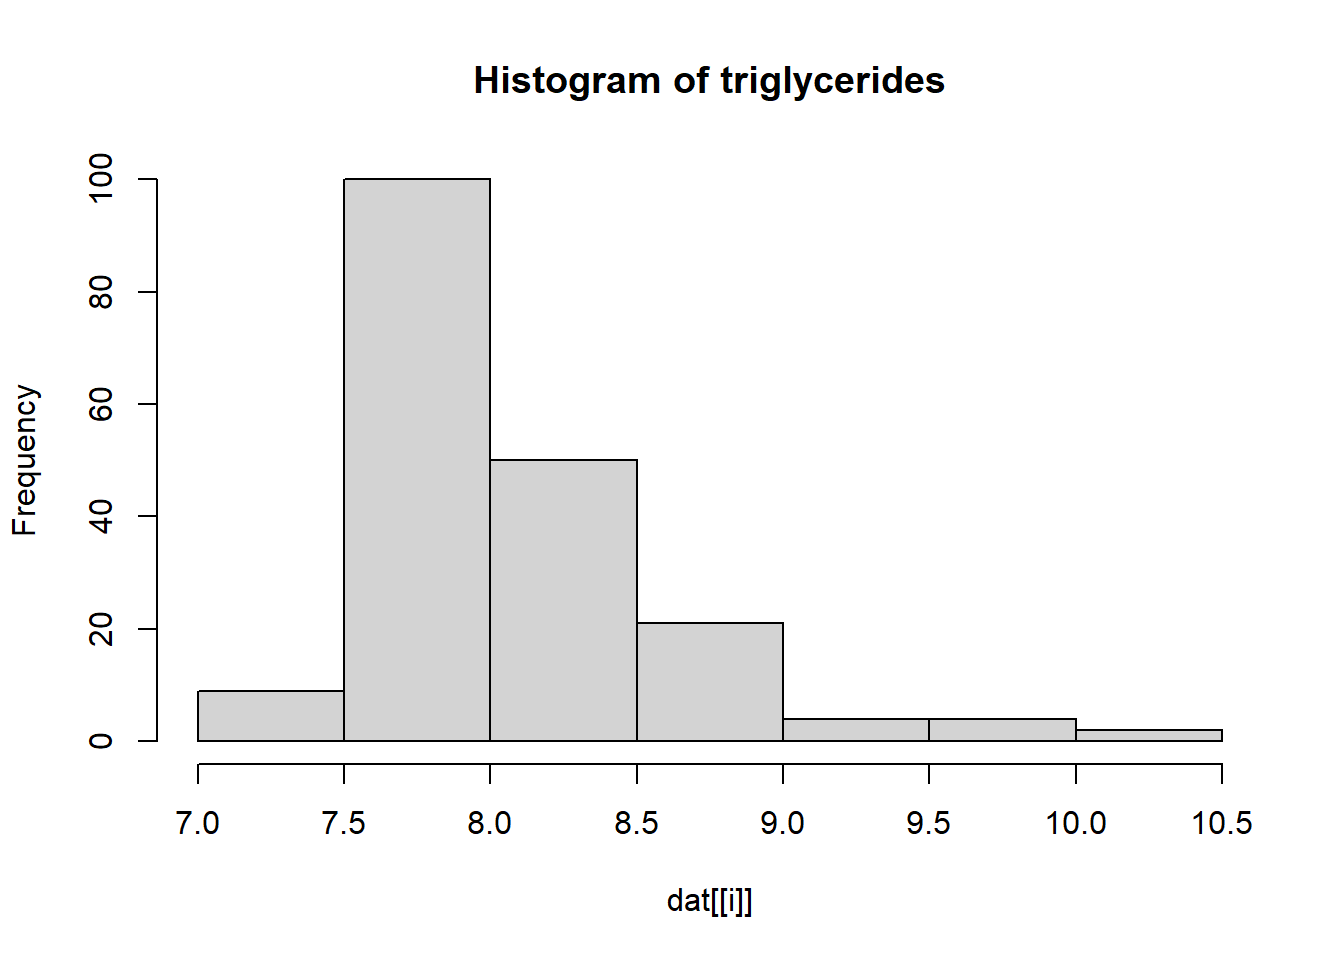{width=672}:::::: {.cell-output-display}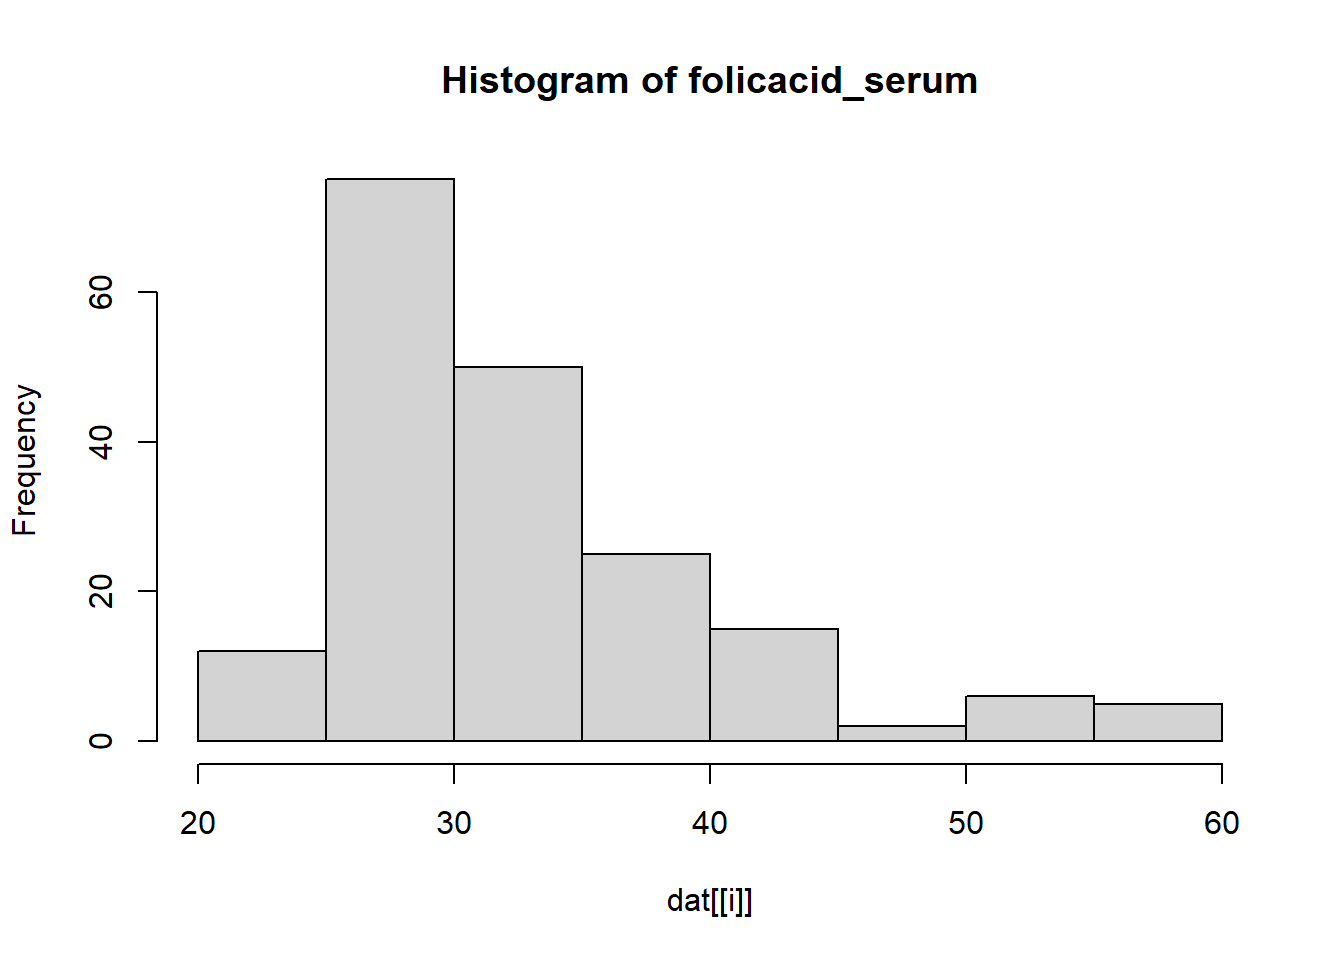{width=672}:::::: {.cell-output-display}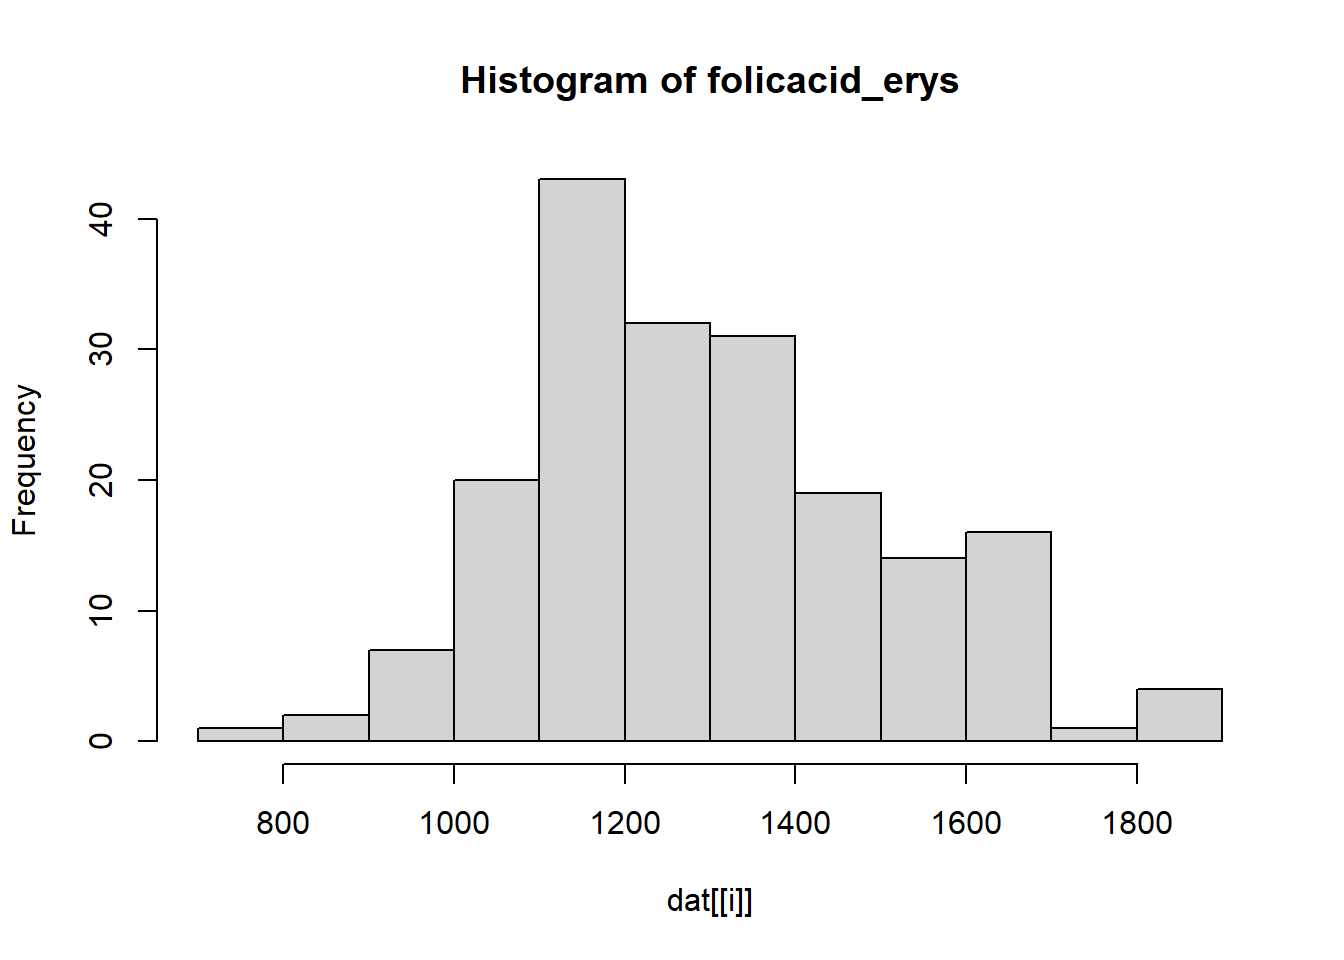{width=672}:::::: {.cell-output-display}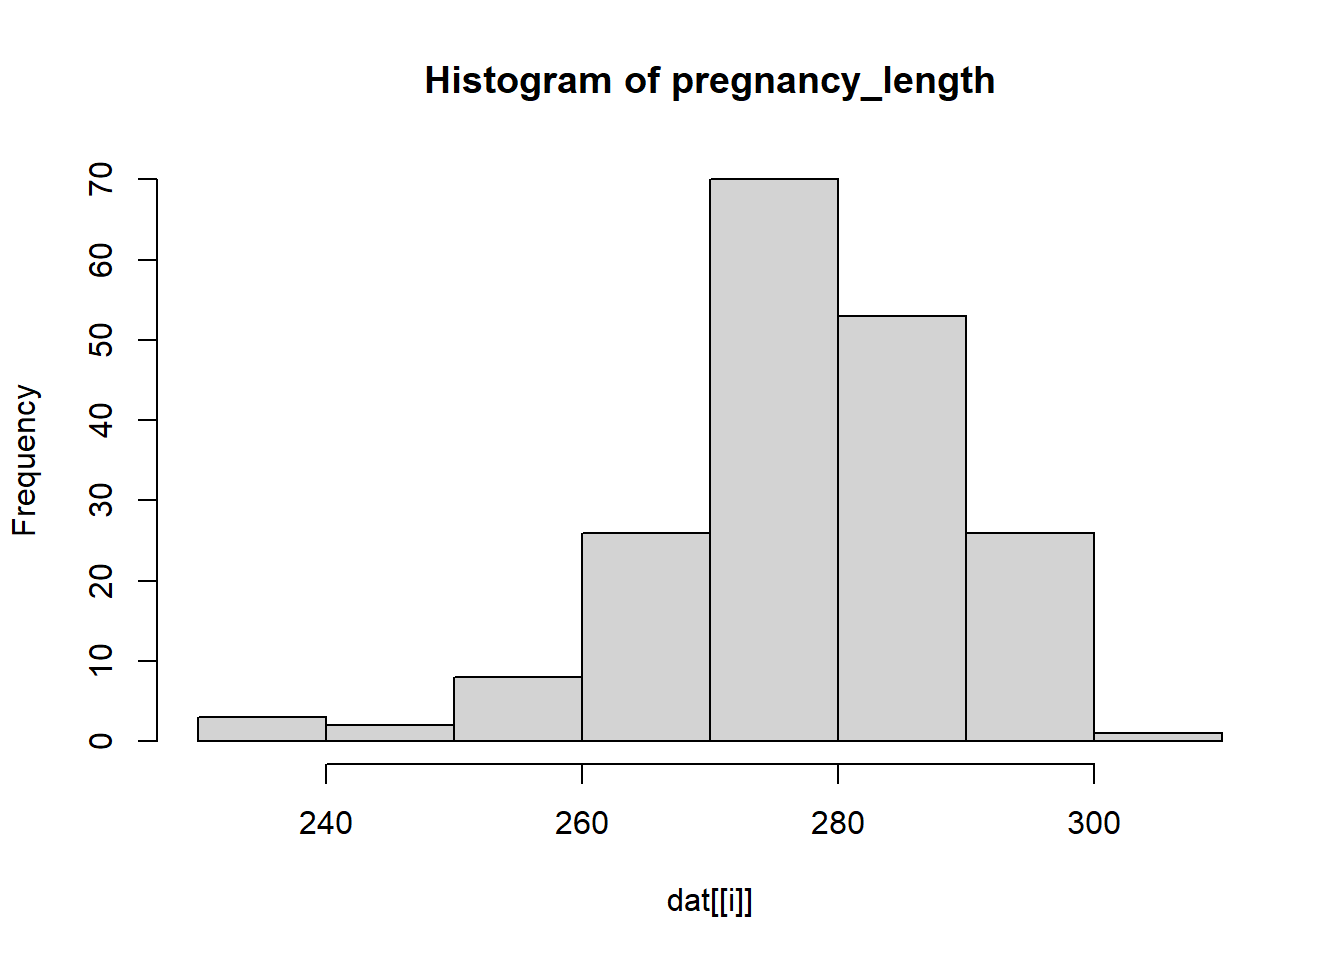{width=672}:::::: {.cell-output-display}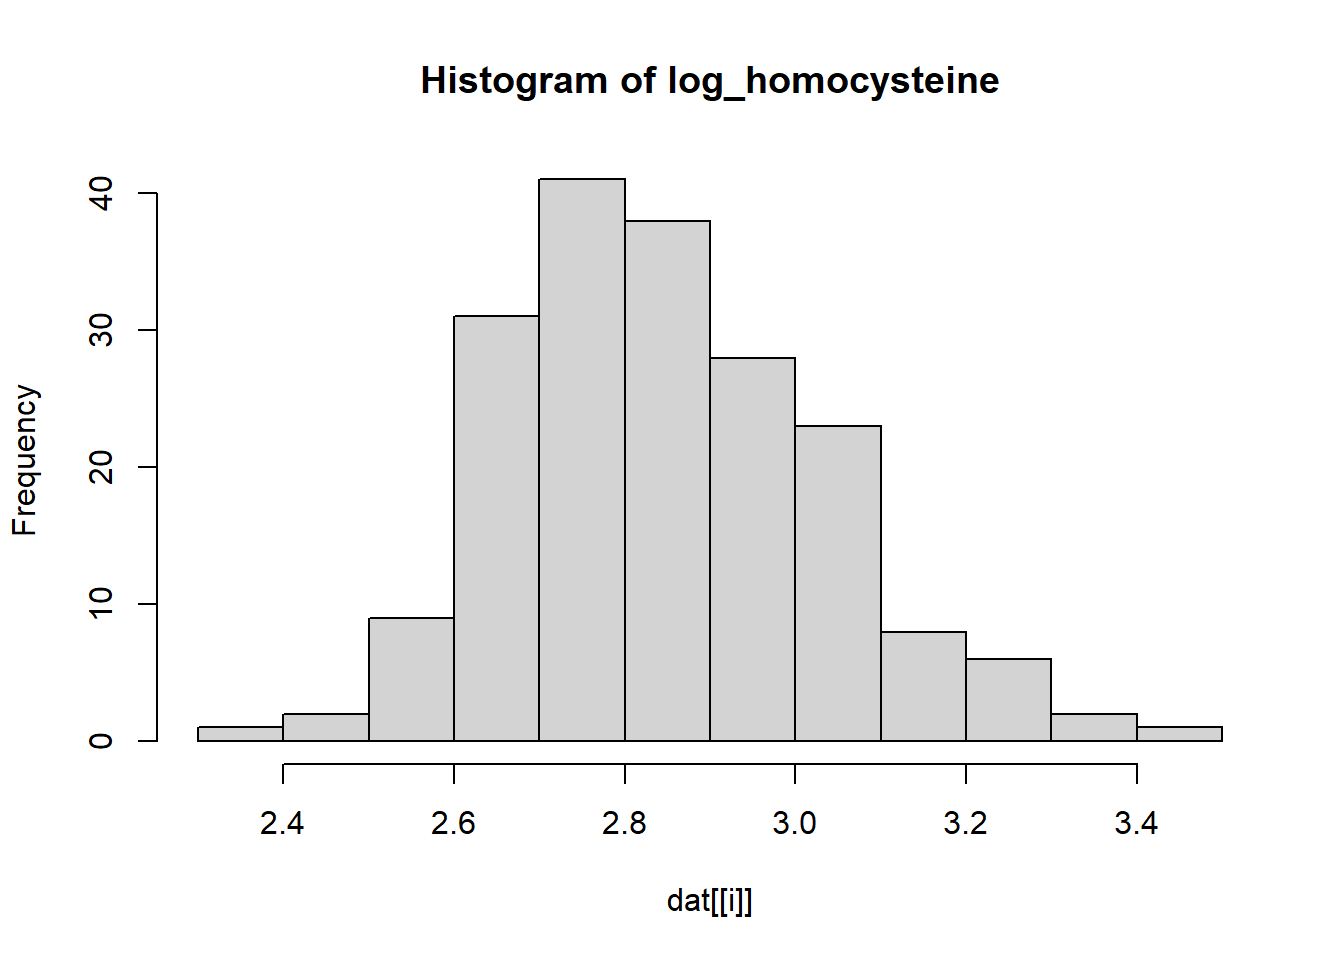{width=672}:::::: {.cell-output-display}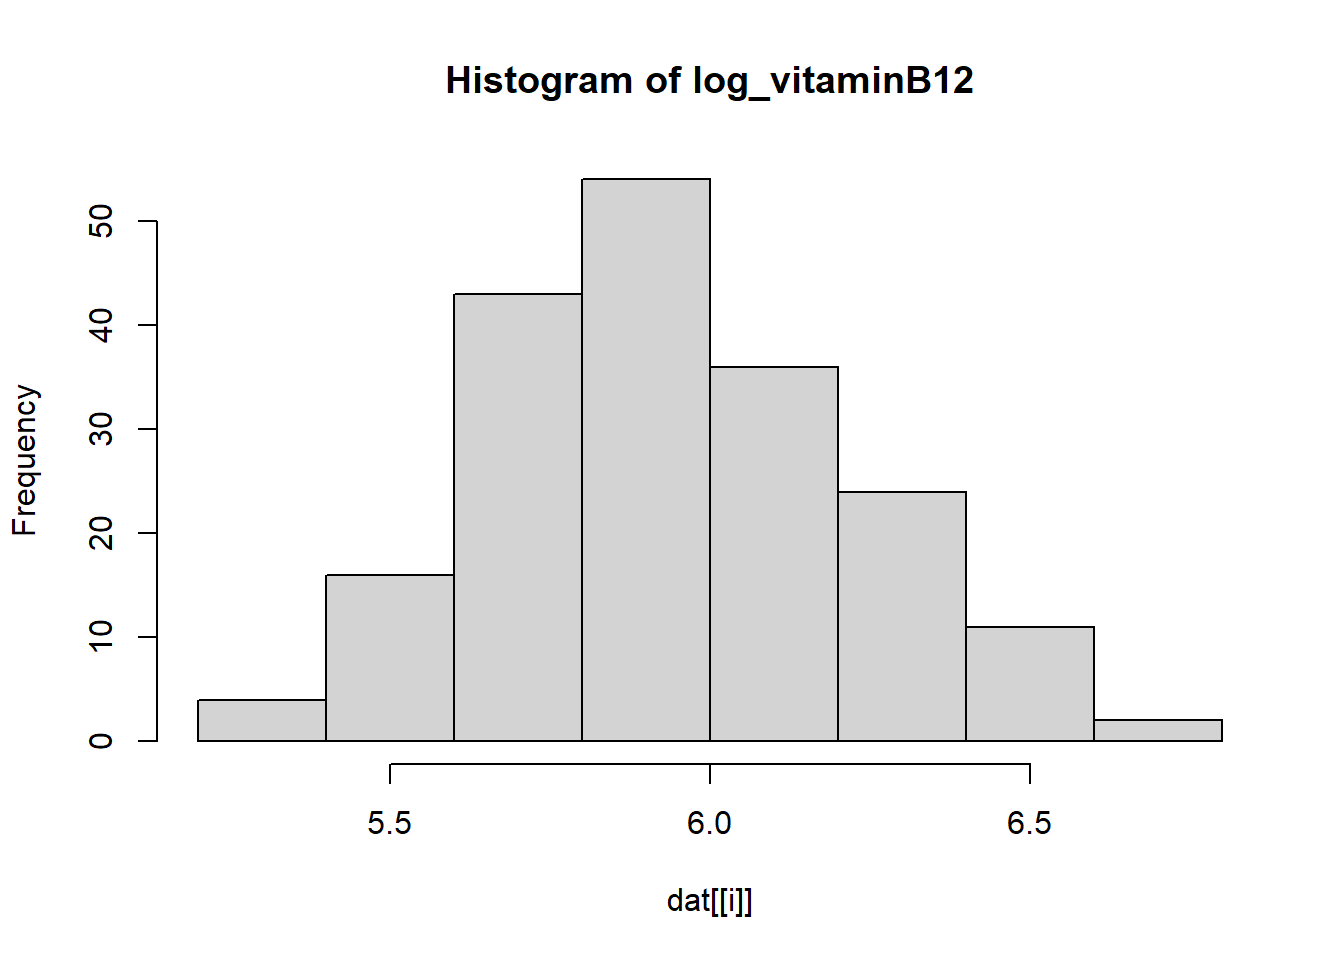{width=672}::::::### Unadjusted AnalysisWe compare the mean of the logarithm of the Vitamin B12 for the two levels of `Status` (normal brain development or intellectual disability).::: {.cell}```{.r .cell-code}t.test(log_vitaminB12 ~ Status,data = dat)```::: {.cell-output .cell-output-stdout}``` Welch Two Sample t-testdata: log_vitaminB12 by Statust = -1.1204, df = 168, p-value = 0.2642alternative hypothesis: true difference in means between group normal brain development and group intellectual disability is not equal to 095 percent confidence interval: -0.13345843 0.03682312sample estimates:mean in group normal brain development mean in group intellectual disability 5.911999 5.960317 ```::::::## Adjusted analysisWe now perform logistic regression analysis to investigate the association between `Status` and log `Vitamin B12` while adjusting for `medication`, `smoking` and `alcohol`.::: {.cell}```{.r .cell-code}glm1_adjusted <-glm(Status ~ log_vitaminB12 + medication + smoking + alcohol, data = dat, family = binomial)summary(glm1_adjusted)```::: {.cell-output .cell-output-stdout}```Call:glm(formula = Status ~ log_vitaminB12 + medication + smoking + alcohol, family = binomial, data = dat)Coefficients: Estimate Std. Error z value Pr(>|z|) (Intercept) -5.19916 3.18418 -1.633 0.102510 log_vitaminB12 0.78068 0.53318 1.464 0.143137 medicationyes -0.25830 0.42863 -0.603 0.546763 smokingyes 1.45931 0.41006 3.559 0.000373 ***alcoholyes 0.05375 0.31425 0.171 0.864181 ---Signif. codes: 0 '***' 0.001 '**' 0.01 '*' 0.05 '.' 0.1 ' ' 1(Dispersion parameter for binomial family taken to be 1) Null deviance: 259.83 on 189 degrees of freedomResidual deviance: 243.72 on 185 degrees of freedomAIC: 253.72Number of Fisher Scoring iterations: 4```:::```{.r .cell-code}coef(glm1_adjusted)```::: {.cell-output .cell-output-stdout}``` (Intercept) log_vitaminB12 medicationyes smokingyes alcoholyes -5.19915783 0.78068485 -0.25830270 1.45930700 0.05375298 ```:::```{.r .cell-code}confint(glm1_adjusted)```::: {.cell-output .cell-output-stderr}```Waiting for profiling to be done...```:::::: {.cell-output .cell-output-stdout}``` 2.5 % 97.5 %(Intercept) -11.5672460 0.9688055log_vitaminB12 -0.2543216 1.8448461medicationyes -1.1217210 0.5712447smokingyes 0.6784664 2.2969129alcoholyes -0.5649230 0.6700994```::::::## Conclusion and Discussion**Main points:*** In the unadjusted analysis, we could not show that the mean of the logarithm of the Vitamin B12 is significantly different for the two levels of `Status`.* In the adjusted analysis, we found that the log `Vitamin B12` is not significantly associated with `Status` while adjusting for `medication`, `smoking` and `alcohol`.